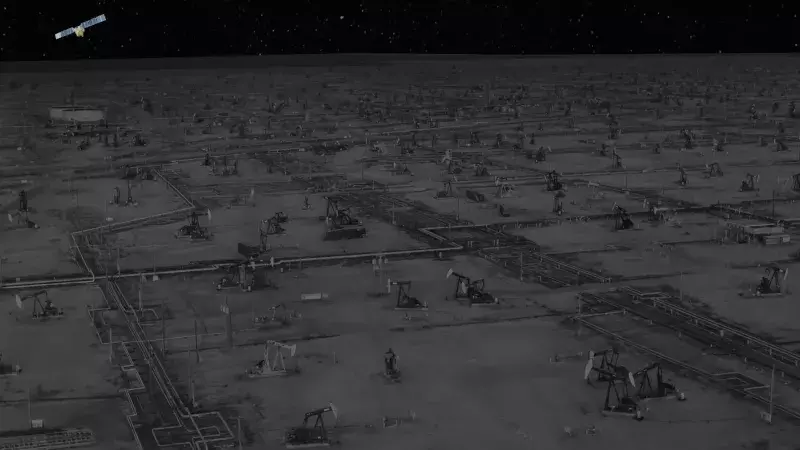
Bridging the gap
MethaneSAT measured methane emissions with unparalleled precision - including emissions that were previously untraceable.
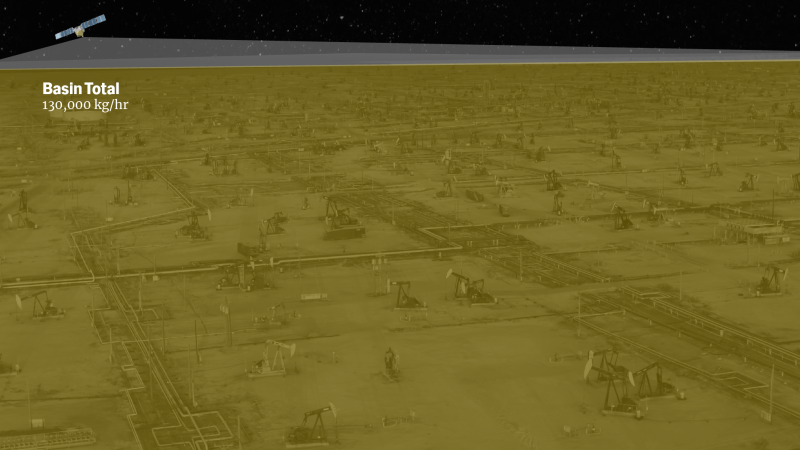
Global mapping
MethaneSAT data reveals total emissions from entire basins.
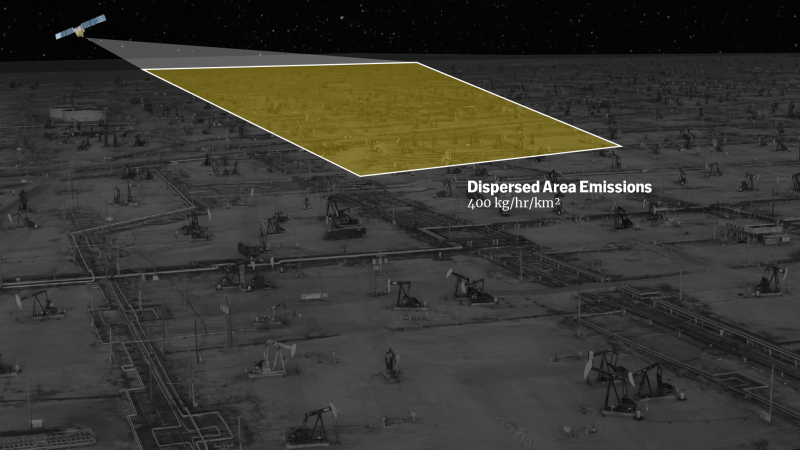
Area mapping
MethaneSAT data shows emissions across a wide region represented on a gridded heat map. These are known as dispersed area emissions or dispersed sources. Grid cells have sizes such as 4 km x 4 km or 5 km x 5 km.
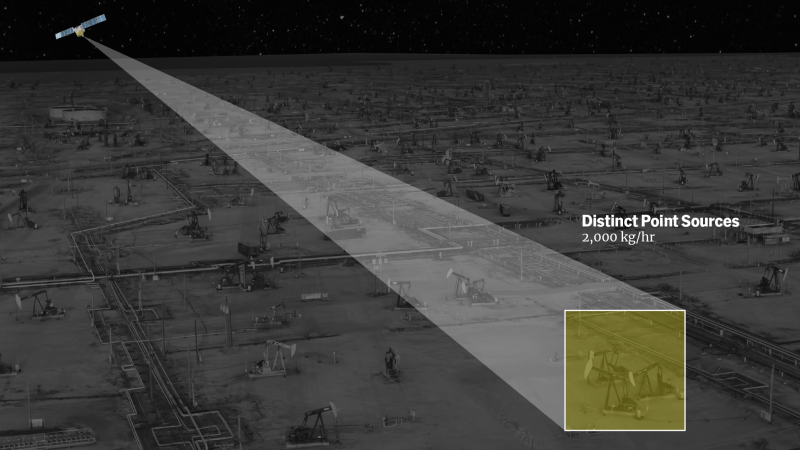
Local mapping
MethaneSAT data shows distinct point sources emitting over 500 kg/hr.

| Capability | Specification |
|---|---|
| Create high-resolution emissions heatmap of area sources (or spatially distributed emissions) | Heatmaps of 1 km2 areas across targets that are 200 km x 200 km, with a native pixel size of 100m x 400m |
| Quantify total regional emissions | Emissions from individual oil/gas fields/basins accounting for more than 80% of global oil and gas production |
| Automate computations used to measure emission rates, cutting a process that can take months down to days | Actionable emission rate data will be accessible in a few days |
| Broad area coverage | Orbit Earth in 100 minutes, with a swath width of 200 km |
| Point source attribution | Trace larger single emission events back to their point source |
| Quantify methane concentrations with high precision | Detect excess methane at 3 ppb (highest precision compared to other satellites in orbit) |
| Transparency | Free public data access |

Two Passive Infrared Littrow Spectrometers
| Wavelengths | 1249 – 1305 nm | 1598 – 1683 nm |
|---|---|---|
| Target species | O₂ | CH₄ / CO₂ |
| Spectral resolution / sampling | 0.20 nm / 0.06 nm | 0.25 nm / 0.08 nm |
| Signal to noise ratio | 190 | 190 |
| Detector | HgCdTe 2k x 2k | HgCdTe 2k x 2k |
| Payload / Observatory mass | 183 kg / 362 kg | 183 kg / 362 kg |
| Orbit altitude | 590 km | 590 km |
| Field of view / swath width | 21 deg / 200 km | 21 deg / 200 km |
| Ground sampling distance | 100 m across track X 400 m along track | 100 m across track X 400 m along track |

How We're Different
Some satellites can track methane on a global scale but can't detect emissions from countless smaller sources responsible for much of the total. Others provide excellent data from known sites with larger emissions but can’t see beyond small areas.
With high precision and a wide view path, MethaneSAT aimed to track emission rates and locations and show how those emissions are changing over time - making it easier to track performance and prioritize solutions.